

Fraser Mercantile’s FM Analytics
Delivers customized end-to-end data analytics solutions and translates complex, and chaotic
data into high-stakes decision-making power for finance and operations leaders.
Who we are
Multi-disciplined consultancy, with 20+ years' experience in business and risk intelligence, data analytics, report
solutioning, governance and change management frameworks, business analysis, and process transformation.


Mission
To build strong, cross-functional and collaborative business relationships, to successfully develop strategic projects, and to deliver scalable data-driven solutions to meet and exceed customers' expectations.
Tailored Solutions
Empowering Your Data Analytics Journey

offerings
To aid clients with improving reporting and analytical efficiencies, Fraser Mercantile offers customized data
analytics and business intelligence tools, to perform ongoing data exploration, automate and enhance existing processes, and to develop new frameworks, all coupled with rigorous change management governance
Key highlights of offerings
Working with our certified Microsoft Solutions strategic partners, Fraser Mercantile can help modernize infrastructure, build low-code applications, and create unified analytics environments. We also offer project-based solutioning for interactive business intelligence and data analytics applications
Change Management / Transformation Process
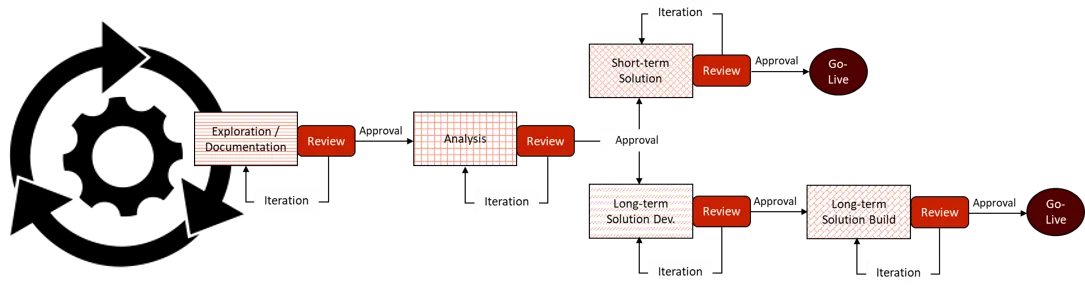
Enhancements to existing data analytics and business intelligence activities follow rigorous change management practices to both, reduce potential disruptive effects to processes, and increase the likelihood of achieving the future state.
Life-cycle and Conceptual Approach
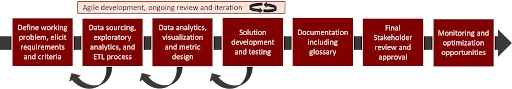
The conceptual approach, performs data analysis and develops proof-of-concept model(s) to communicate capabilities and strategize on enhancing reporting metrics, while developing data analytics processes in parallel.
Exploratory Data Analytics (EDA)
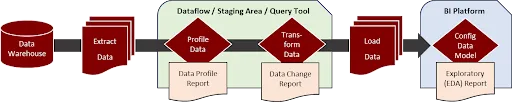
EDA performed on data sources through extract, transform and load (ETL) processes allowing for profile analysis and reporting, cleaning and transformation, and data change management, without affecting underlying sources
Customized Parameters
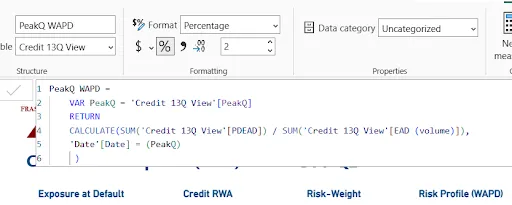
Development of parameters, indices, and variables enhancing period-over-period performance with straight-forward maintenance
Report and Dashboard Builds
Development of automated, transparent, interactive, and reusable visualization tools to analyze trends, identify key drivers to explain changes, and provide actionable insights to decision makers. Custom builds provide secure, interactive and automated reporting solutions, aid in fulsome results analysis, and garner actionable insights.

Credit Risk Capital Report


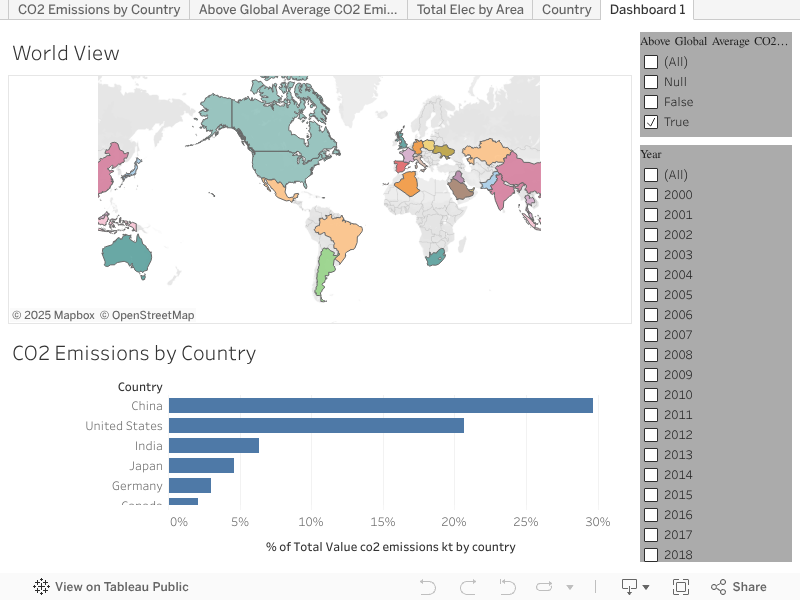
Tableau
Global CO2 Emissions
Looking for a customized end-to-end
data analytics solution?
Allow Fraser Mercantile, and its strategic partners, to help your organization harness the full potential of the Microsoft ecosystem and prepare your business for the AI-powered future.
contact us
STILL NOT SURE?
Frequently Asked Questions
Everything You Need to Know About Us
What specific data analytics services does Fraser Mercantile offer?
FML provides full Business Intelligence and data analytics services. This includes, data transformation, and cleaning, descriptive, diagnostic and predictive analysis, parameter, metric and KPI development, data visualizations and interactive report and dashboard builds.
Does FML specialize in any particular data analytics tools or technologies? If so, which ones?
While we can develop reporting solutions in several business intelligence platforms, we specialize in Power BI and Tableau.
What differentiates your data analytics services from competitors in the market?
Beyond the data analytics services, we have over 2 decades of methodology development, and reporting and analysis for Financial Institutions, spanning Enterprise, Credit and Climate risks. We have worked and collaborated with both business and technology partners to deliver value add and transparent data-driven solutions.
Can you describe a recent project that showcases your company's capabilities?
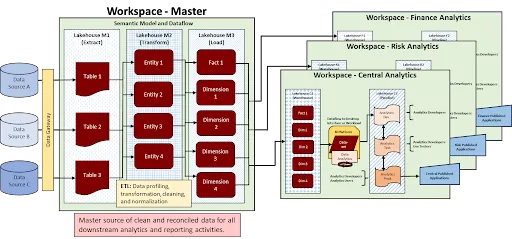
We recently developed and delivered an end-to-end structured data gathering process and assessment model solution, for a government ministry, providing them the ability to perform four key functions:
- Data-driven decision making
- Enhanced industry oversight
- Increased transparency for all stakeholders with granular contrast and compare capabilities
- Streamlined approval processes
What size of companies do you typically work with?
We have worked with very large institutions (billions $ in assets) to smaller independent operators.
What common pain points or challenges do your ideal clients typically face?
The largest common pain point is data. Typically, their data is:
In a very rough state, requiring formatting, cleaning and transformation
Denormalized, making analysis very inefficient
A mystery, where the client simply does not know what they have and what to do with it
What technical infrastructure or data maturity level should potential clients have?
This is really dependent on the client size. While we have worked with clients who maintain data in spreadsheets, we would recommend organizations should have, at a minimum, a database solution (i.e. SQL Server), but this is also an area for discussion to potentially be improved upon.
What initial low-commitment engagement options do you offer for new clients to experience your
services?
For a short term (i.e. 4-week) engagement, FML can develop a customized and interactive report and dashboard package through data importing. This would be fully transparent, secure, and internet accessible by the client, across both desktop and mobile devices. Further, this may be maintained and updated under a monthly service contract.